About SAD-strain
Strain analysis from distorted selected area electron diffraction patterns
SAD-strain is a set of plugins for the Gatan™ DigitalMicrograph platform which allow to
quantify the elliptic distortions in selected area electron diffraction patterns.
The plugins were developed to measure the peak positions of diffuse amorpous diffraction rings
as well as the center of the patterns with sub-pixel accuracy. The peak maxima position is
obtained by nonlinear least squares fitting of a pseudo-Voigt function to line profiles obtained
from azimuthally integrated sectors. The center of the patterns is evaluated by fitting an
ellipse to the obtained peak positions. The 2D atomic-level strain form the patterns is
finally obtained form the diffrence in peak positions with respect to the reference pattern. The
fit parameters are written to an excel file for an extended evaluation of e.g. variations of the
FWHM.
Here a quick introduction to the functionality is given. A more detailed description of the
algorithm can be found in the following publication:
C. Ebner, R. Sarkar, J. Rajagopalan, C.Rentenberger. Local atomic-level elastic strain
measurements of metallic glass thin films by electron diffraction (2016) Ultramicroscopy
Introduction
After installation you will have two additional menu entries from which you can call the plugins dialogs.
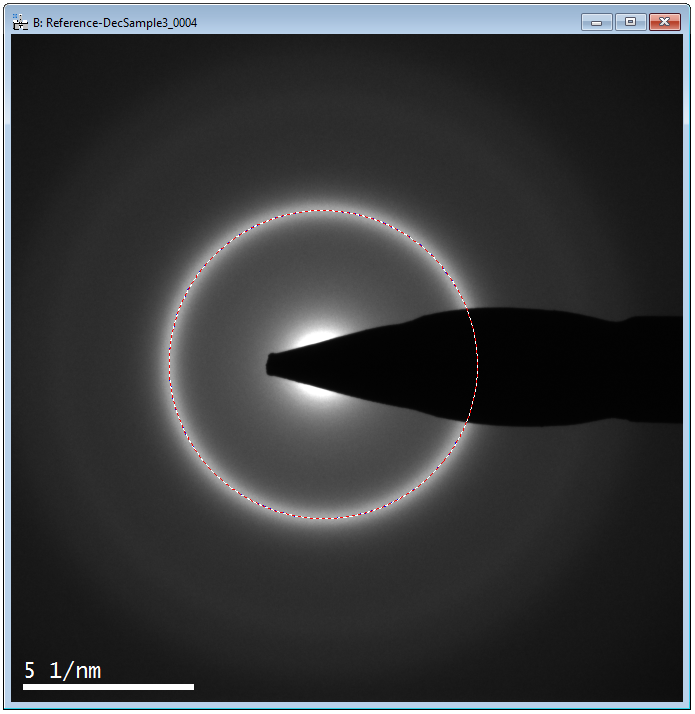
The "Ellipse Fit" dialog lets you perform the exact determination of the center and the profile
fits for each sector in an easy and automated way. It fits an ellipse to the maxima positions
found inside the area selected by the ring mask (see Figure below).
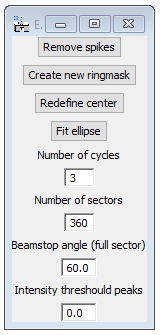
By setting the "Number of sectors" you define into how many sectors the pattern is divided,
giving therefore the number of datapoints for the ellipse fit (assuming the "Beamstop angle"
is 0). Sectors contained in the +/- half the given beamstop angle are excluded from the
evaluation.
Each sector is integrated along the angular direction and a pseudo-Voigt function is fitted to
the resulting profiles for sub-pixel precision in determination of the peak position. The
"Number of cycles" defines how many times the routine is repeated iteratively to refine the
data.
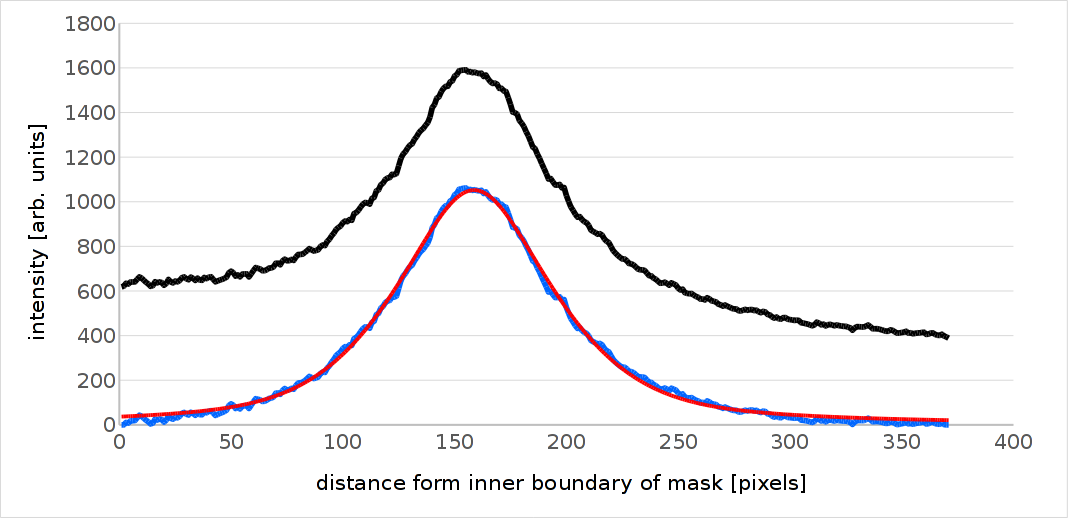
An example for the pseudo-Voigt fit is given in the image below. The integrated sector is frst smoothed to find the mimima before and after the peak. These minima are used to subtract a linear background form the unsmoothed data (black). The background subtracted data (blue) is finally used for the fit (red).
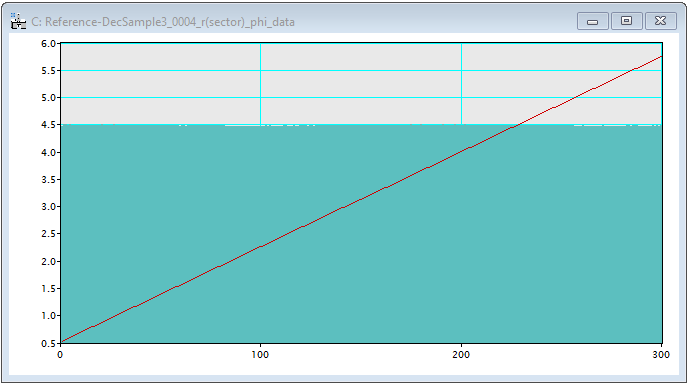
After fitting the plugins will draw the found maxima positions (blue-white) as well as the fitted ellipse (red-white) as ROIs into the pattern. This allows to visually check the fit. In addition the plugin will output a new window containing the polar data of the peak maxima positions relative to the fitted center. This image is needed to evaluate the strain tensor using the "StrainTensor" dialog. More details on the individual sectorwise profile fits can be found in the excel sheet written into the 'DMEllipseFitResult' folder in the users 'Documents' folder.